
Every cycle has a number investors learn to ignore at the worst possible time.
In 1999, it was screaming.
In 2021, it was dismissed.
In 2026, it is back near historic extremes.
That number is the Shiller P/E, also known as the CAPE ratio — the cyclically adjusted price-to-earnings ratio.
And right now, it is telling investors something uncomfortable:
The market is not cheap. It is not fairly valued. It is not even mildly expensive.
It is priced for a near-perfect decade.
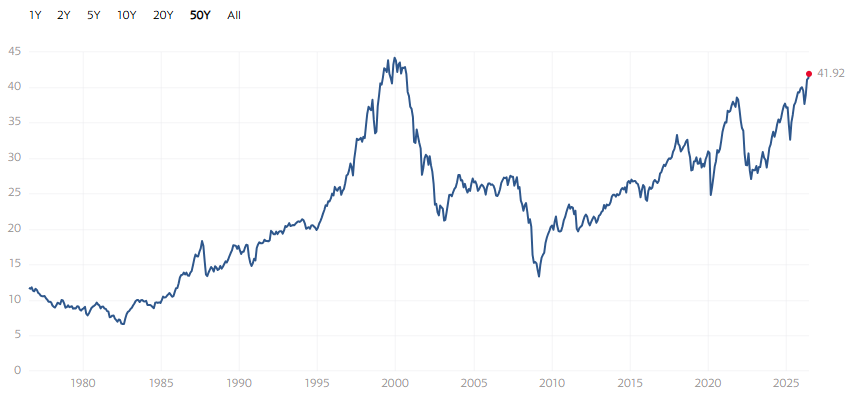
As of the U.S. close on June 16, 2026, Multpl shows the S&P 500 Shiller P/E at 41.92. Other providers differ slightly — GuruFocus shows the CAPE around 40.72 for June 2026 — but the message is the same: U.S. equities are trading at one of the richest valuation levels in modern market history.
For context, Multpl lists the long-term average Shiller P/E at 17.39, the median at 16.10, and the all-time peak at 44.19 in December 1999.
That is the dot-com bubble neighborhood.
But the most interesting part is not simply that the market is expensive.
Investors already know that.
The more interesting part is that this valuation warning is arriving at the same time as something else:
The IPO window is reopening.
And when valuations are stretched, risk appetite is high, and private companies suddenly regain access to public-market liquidity, stock pickers need to ask a simple question:
Are we being offered opportunity — or inventory?
Because IPOs do not only tell us what investors want to buy.
They also tell us what insiders want to sell.
What the Shiller P/E Actually Measures
The normal P/E ratio compares today’s price to the last year’s earnings. That can be useful, but it can also be misleading.
Earnings collapse during recessions. They spike during booms. They are distorted by margins, accounting changes, write-offs, buybacks, and temporary shocks.
The Shiller P/E tries to smooth that out.
It divides the S&P 500 price by the average inflation-adjusted earnings of the previous 10 years. In plain English, it asks:
How much are investors paying today for a decade of real earnings power?
That is why the Shiller P/E is also called the cyclically adjusted P/E ratio, or CAPE.
Robert Shiller’s long-run market dataset goes back to the nineteenth century and is available through his Yale online data page. That long history is what gives the metric its power. It allows investors to compare today’s valuation not just with the last cycle, but with more than a century of market regimes.
CAPE is not built for traders.
It will not tell you where Nvidia trades next week. It will not predict the next Fed decision. It will not tell you whether the next CPI print causes a one-day rally or selloff.
But it does something arguably more important:
It tells you how much future return has already been pulled into today’s price.
The Setup Investors Should Not Ignore
A CAPE near 42 does not mean the market has to crash tomorrow.
Markets can stay expensive. Expensive markets can get more expensive. Momentum can overpower valuation for longer than disciplined investors expect.
But valuation still matters.
Historically, elevated valuation levels have been far more useful for thinking about long-term forward returns than for timing short-term market moves. Campbell and Shiller’s work on valuation ratios found that these ratios were not especially useful at forecasting future earnings or dividend growth, but they were useful in forecasting future stock price changes over longer horizons. Their paper, “Valuation Ratios and the Long-Run Stock Market Outlook,” remains one of the core references behind the CAPE debate.
That distinction matters.
The Shiller P/E is not a countdown clock.
It is a gravity reading.
And right now, gravity is heavy.
At the same time, the IPO market is suddenly interesting again. According to Renaissance Capital’s 2026 IPO market stats, there have been 73 U.S. IPOs priced year-to-date, down 18.9% from the prior year, but total proceeds have reached $110.9 billion, up 667.8% year-over-year.
That is the key detail.
The IPO market is not necessarily euphoric because hundreds of tiny companies are listing.
It is euphoric because the deals that are getting done are enormous.
The clearest example is SpaceX. Reuters reported that SpaceX first raised a record $75 billion in its IPO at $135 per share, valuing the company at roughly $1.77 trillion. After underwriters exercised the greenshoe option, Reuters later reported that total IPO proceeds rose to $85.7 billion. The deal became the largest IPO in history before the greenshoe was even exercised.
This is not a normal IPO market.
This is a liquidity event on an institutional scale.
And that is where the uncomfortable question begins.
The market does not have to collapse from here. In fact, it may not. Expensive markets can always become more expensive.
But when public-market investors are willing to pay one of the highest valuation multiples in history, and private owners are suddenly able to sell giant blocks of equity into that demand, stock pickers should slow down.
The question is not whether every IPO is bad.
The question is whether the public market is once again becoming the exit door for smart money.
What a CAPE Near 42 Actually Means
Let’s be precise.
A Shiller P/E around 42 is not merely “above average.”
It is extreme.
Multpl lists the long-run mean at 17.39 and the median at 16.10. The only truly comparable modern peak was the dot-com bubble, when CAPE reached 44.19 in December 1999.
Today’s reading is not identical to 1999. The index is different. The market structure is different. The largest companies are more profitable. Buybacks are more important. Software and platform businesses deserve different multiples from old industrial cyclicals. Interest rates, inflation, and margins all matter.
But valuation still means something.
At a CAPE near 42, the market is effectively saying:
Corporate profits will remain strong. Margins will stay elevated. AI capital spending will generate real productivity. The Fed will not break the cycle. Geopolitical risk will stay manageable. Investors will continue paying premium multiples. And earnings growth will be strong enough to justify prices that already discount a lot of good news.
That is a lot of perfection.
This is why CAPE should not be used as a simple “sell signal,” but it should be used as a discipline signal.
The point is not:
CAPE is high, therefore sell everything.
The point is:
CAPE is high, therefore the index is priced for a low-error decade.
That is very different.
In cheap markets, broad exposure can do a lot of the work. You can buy the index, hold through volatility, and let multiple expansion and earnings recovery carry the portfolio.
In expensive markets, the game becomes harder.
The index may still go up. But the margin of safety shrinks. Future returns become more dependent on flawless execution, continued earnings growth, and investor willingness to maintain elevated multiples.
For stock pickers, that means selectivity becomes more valuable.
The market can be expensive while individual opportunities still exist.
But the burden of proof shifts.
You cannot be casual with valuation when the index itself is already priced like a premium asset.
Why CAPE Is Useful — And Why It Can Mislead You
The bearish CAPE argument is simple:
Valuations are too high. Future returns will be poor.
The bullish counterargument is also worth taking seriously.
Today’s S&P 500 is not the S&P 500 of 1920, 1950, or even 2000. It is more global, more asset-light, more technology-driven, and more concentrated in highly profitable companies with strong competitive positions.
Accounting standards have changed. Buybacks have replaced dividends as a major form of capital return. Intangible assets are poorly captured by traditional accounting. Large platform companies can scale in ways old industrial companies could not.
So yes, using the 150-year average CAPE as a fixed fair-value anchor is too simplistic.
Vanguard has repeatedly made a version of this point: valuations matter a lot for long-term returns, but they are not reliable short-term timing tools. In a 2025 piece, Vanguard described valuations as acting like gravity over the long run, while also warning that elevated valuations alone do not usually trigger corrections. In its April 2026 return outlook, Vanguard noted that U.S. equities remained significantly above long-term fair value even after some valuation improvement earlier in the year.
That is the balanced view.
CAPE is not a magic wand.
It does not know when a bubble ends.
It does not know whether AI productivity will be real.
It does not know whether today’s mega-cap margins are structurally sustainable.
But it does know this:
The more you pay for earnings, the less room you have for disappointment.
That is the part investors often forget near the top of a cycle.
The IPO Window Is Open — And That Changes the Signal
The IPO market matters because it tells us something about liquidity.
When public markets are weak, private companies delay listings. Founders wait. Venture funds wait. Private equity sponsors wait. Bankers talk about “market windows” being closed.
When public markets are strong, the window opens.
And when that happens, supply arrives.
Morgan Stanley recently described the 2026 IPO market as larger, broader, and increasingly shaped by later-stage companies, financial sponsors, retail investors, and multiple capital-raising channels. The most important line in its analysis was this:
Financial sponsors are central to IPO supply, as private equity firms work through mature portfolios and turn to public markets for exits.
That sentence should matter to stock pickers.
Because an IPO is not just a growth story.
It is a transaction.
One side is buying.
One side is selling.
The buyer sees opportunity.
The seller sees liquidity.
Both can be right. But they are not playing the same game.
For founders, early employees, venture funds, and private equity sponsors, an IPO can convert years of illiquid ownership into public-market liquidity. For public investors, that same IPO can be the first chance to own the company — but often at a valuation already shaped by years of private-market markups, banker storytelling, and institutional demand.
This is why the phrase “smart money exit liquidity” is emotionally loaded but analytically useful.
It does not mean every IPO is a dump.
It means investors should ask whether the public market is being used as a financing venue, a growth platform, or an exit machine.
Those are very different things.
Is Smart Money Looking for Exit Liquidity?
The honest answer is:
Partly, yes.
Not in a cartoonish way. Not every IPO is cynical. Not every insider is selling at the top. Great companies do go public. Amazon, Google, Visa, Mastercard, and Tesla were all once new issues.
But incentives matter.
Private companies stayed private for longer during the 2010s and early 2020s. Venture capital funds raised huge pools of capital. Private equity firms accumulated mature assets. Employees received equity compensation that was valuable on paper but illiquid in practice. Limited partners want distributions. Sponsors need realizations. Founders want diversification.
When the public market is willing to pay premium multiples, it becomes rational for private owners to sell.
That is not immoral.
That is capital markets.
But public investors should not pretend the incentives are neutral.
Reuters’ reporting around the SpaceX IPO highlights why this moment feels different. The company raised $75 billion initially, then $85.7 billion after the greenshoe, and attracted enormous demand. Reuters also reported that SpaceX allocated an unusually large share of the IPO to retail investors compared with the typical large IPO structure.
That retail component matters.
Retail participation is not automatically bad. In fact, broadening access can be good.
But late-cycle markets often have a recognizable pattern: insiders and institutions own the asset privately for years, valuation expands, the public narrative becomes irresistible, and retail investors finally get access when the story is already famous.
Sometimes that still works.
Often, the price already reflects the dream.
The danger for stock pickers is not buying IPOs.
The danger is buying IPOs without understanding who is selling, why they are selling, and what assumptions are embedded in the price.
The IPO Trap: Great Company, Bad Stock
The biggest mistake investors make with IPOs is confusing a great company with a great stock.
A company can be strategically important and still be overpriced.
A company can dominate its industry and still deliver poor returns from the IPO price.
A company can have a massive total addressable market and still disappoint shareholders if expectations are already too high.
That is especially true in mega-IPOs.
LPL Research recently analyzed roughly 1,494 IPOs from April 1995 to April 2025. From the first-day closing price, the average one-year return was positive, but the median was negative. More importantly, the average maximum drawdown in the first year after an IPO was nearly 49%. LPL’s conclusion was clear: IPO investing can offer opportunity, but investors need to be prepared for significant volatility and a high failure rate relative to the index.
That is the reality.
The first-day pop gets the headlines.
The first-year drawdown teaches the lesson.
The IPO game is asymmetric, but not in the way retail investors usually think. Early investors, employees, venture funds, and sponsors often own shares at much lower cost bases. Banks and favored institutions may receive allocations at the offer price. Public investors often chase after trading begins, once the easy upside has already been absorbed by the initial pop.
That does not mean avoid all IPOs.
It means underwrite them like a skeptical buyer, not a fan.
The right question is not:
Is this company exciting?
The right question is:
What has to be true for this stock to work from this valuation?
Those are completely different questions.
The Stock Picker’s IPO Checklist
In a market with a Shiller P/E near 42, investors should raise their standards.
Before buying any IPO, especially a mega-IPO, ask these questions:
1. Who is selling?
Is the IPO mainly raising primary capital for the business, or is it allowing insiders and sponsors to monetize existing shares?
Primary issuance funds growth.
Secondary sales fund exits.
Both can be acceptable, but they send different signals.
2. How much of the company is actually floating?
A small float can create scarcity and push the stock higher early.
But that same small float can become a problem later when lock-ups expire and more shares hit the market.
Scarcity can support the stock temporarily.
Supply can reprice it later.
3. Are insiders locked up?
Traditional lock-up periods help prevent immediate insider selling. If restrictions are shortened, waived, or unusually flexible, investors should pay attention.
The question is simple:
Are insiders economically aligned with new shareholders after the IPO, or are they already preparing to sell?
4. What is the valuation based on?
Is the company valued on earnings?
Revenue?
Gross profit?
Adjusted EBITDA?
A distant 2035 total addressable market?
Or pure narrative?
The further the valuation depends on future possibility rather than current economics, the more fragile the stock becomes.
5. Is the company coming public because it is ready — or because the window is open?
This is one of the most important questions.
Great companies go public when public ownership makes strategic sense.
Weaker deals go public when market conditions are temporarily favorable.
The distinction is subtle before the IPO.
It becomes obvious later.
6. What needs to go right?
At high valuations, the market is not pricing in average execution.
It is pricing in excellence.
Ask what assumptions are required: revenue growth, margin expansion, market share, capital intensity, regulation, competition, dilution, and interest rates.
If too many things need to go right, the margin of safety is probably too thin.
7. Would you buy this company at this valuation if it had already been public for five years?
This question removes the IPO excitement.
If the ticker were boring, the CEO were not on magazine covers, and the stock had no first-day hype, would the valuation still make sense?
If the answer is no, you may not be underwriting an investment.
You may be underwriting a story.
Why This Matters More Now Than It Did Two Years Ago
The current market backdrop makes the IPO question more important.
On June 16, Reuters reported that the Nasdaq and S&P 500 slipped while the Dow hit another record close. Technology was the weakest major sector, and the Philadelphia Semiconductor Index fell sharply after a strong run. SpaceX, meanwhile, continued to surge after its IPO and options trading activity intensified.
That is a strange mix:
Record highs.
AI enthusiasm.
Mega-IPO demand.
Tech fatigue.
Retail participation.
Private-market exits.
Elevated valuation.
This does not prove the market is at a top.
Markets are never that easy.
But it does suggest the risk-reward has changed.
When CAPE is low, investors can afford to be more forgiving. When CAPE is high, mistakes become expensive. And when CAPE is high while insiders are selling assets into a hot IPO window, investors should become even more selective.
The market is not necessarily telling you to panic.
It is telling you to stop being generous.
The Real Message of the Shiller P/E
The Shiller P/E is not a trading signal.
It is not a reason to sell every stock.
It is not proof that a crash is imminent.
It is a valuation lens.
And through that lens, today’s market looks expensive, crowded, and increasingly dependent on optimistic assumptions.
That does not mean there are no opportunities. There are always opportunities for stock pickers who are willing to do the work.
But in this kind of market, the winners need to be real.
Real earnings.
Real free cash flow.
Real competitive advantages.
Real reinvestment opportunities.
Real alignment between insiders and shareholders.
The more expensive the market becomes, the less tolerance investors should have for vague stories, adjusted metrics, and heroic forecasts.
Final Thought
The Shiller P/E is not screaming because stocks must collapse tomorrow.
It is screaming because the price of patience has changed.
At a CAPE near 42, public investors are paying one of the richest multiples in U.S. market history. At the same time, the IPO window is reopening, mega-deals are hitting the market, and private owners finally have a way to turn paper wealth into liquidity.
Maybe this is the start of a new productivity supercycle.
Maybe AI transforms margins, growth, and capital efficiency enough to justify valuations that look extreme by historical standards.
Maybe today’s mega-IPOs become tomorrow’s great compounders.
But stock pickers do not get paid to believe stories.
They get paid to underwrite risk.
And right now, the risk is not just that the market is expensive.
The risk is that expensive public markets are becoming the exit door for private capital.
The exits are open.
The multiples are rich.
The crowd is excited.
That is exactly when discipline matters most.
More Articles

AI Is Creating an Inflation Nobody Is Measuring
The cost of producing music, code, and digital labor is collapsing. The volume is exploding. The market consequences are stranger than they look.

AI Won’t Kill SaaS. It Will Charge You Twice.
The old software model charged for employees. The new model charges for employees—and the AI agents doing part of their work.

The AI Trade Is Not a Bubble. It Is a Game of Chicken.
The question is not whether AI is real. The question is who gets paid — and who is only financing the table.